Income inequality has reached its highest level since the U.S. Census Bureau began tracking the measure more than 50 years ago, according to data released this week.
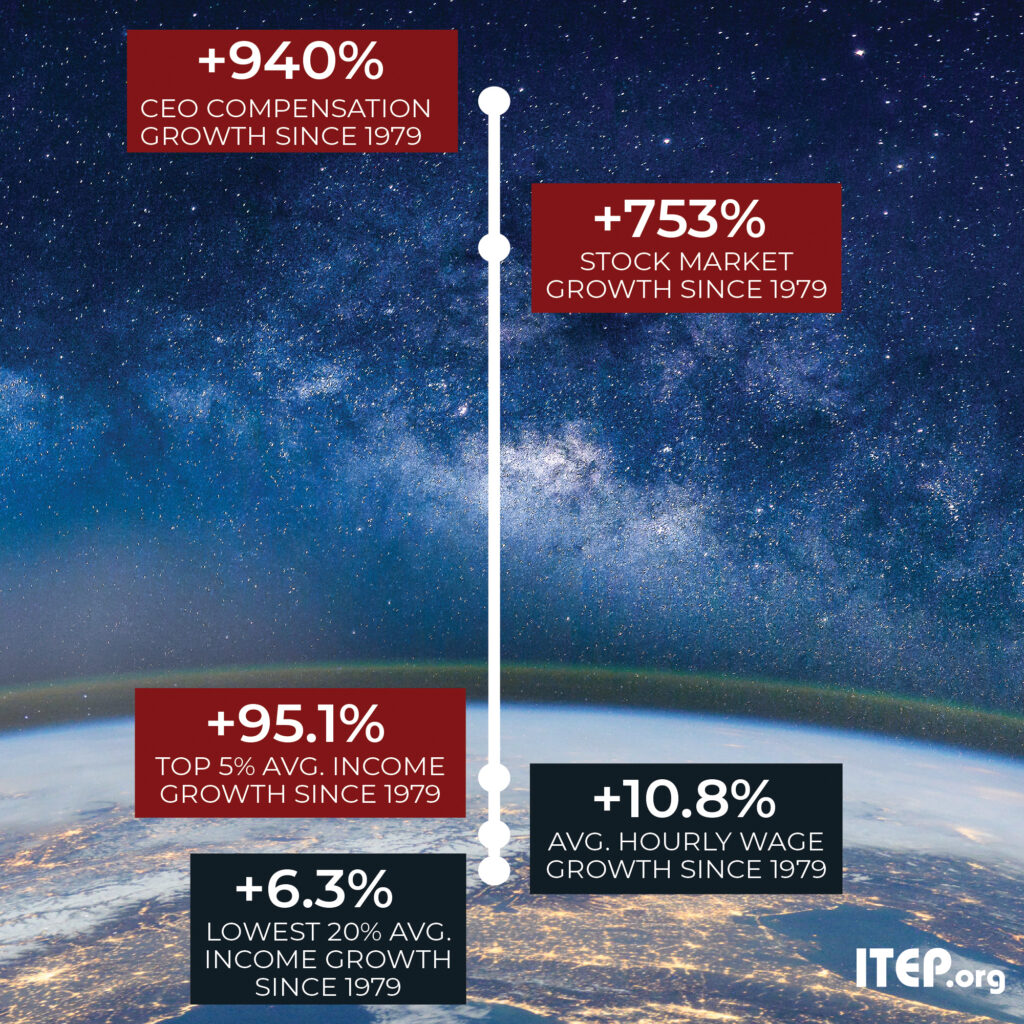
While recent Census data show modest increases in median household income and average hourly wages—numbers anti-tax politicians and pundits have used to deny rising inequality—a deeper look at some of the latest numbers reveals a decades-long trend of widening economic inequality.
Take a look at the chart below. Over the past 40 years, CEOs’ compensation and stock market growth has climbed astronomically compared to average hourly wage growth for all workers and income growth for the bottom 20 percent.

